The Australian Economy: Whither To From Here?
By Alan Austin: Independent Australia.
The latest official data on Australia’s economy reveals serious structural problems making all workers poorer, as Alan Austin reports.
A RECENT EMAIL from the office of Dr Jim Chalmers mysteriously lost the first letter of his title, thus describing him as the nation’s ‘reasurer’. The email contained a transcript of an interview in which the Treasurer said he was “working around the clock on this Budget which is to be handed down next month” and doing “what we can to get wages moving again”. He is a “reasurer” indeed.
The nation now needs more than just a minister who can comfort and console. The Australian Bureau of Statistics (ABS) has just detailed the precise state of the economy in the quarterly national accounts.
Straits for workers are much direr than previously revealed. The numbers confirm deep structural issues left by the grossly incompetent previous regime.
Dismal economic growth
Quarterly growth in gross domestic product (GDP) was 0.89% in the June quarter, bringing the annual growth rate to 3.59%. These outcomes are poor, given the vast quantities of commodities shipped out of the country at record prices.
The whole world is experiencing buoyant trade, high employment and steady GDP growth. Australia’s quarterly growth rate ranks 18th among the 38 OECD members; annual growth ranks a bleak 22nd. Those placings are slightly better than last year’s which were the lowest ever recorded, but remain far below where Australia ought to be.
We should note that only the last of the three months of the June quarter was under Labor and their policy shifts would not have taken effect by then. So all these outcomes are the legacy of the previous Coalition Government.
Scrapping Stage 3 tax cuts is essential, but won’t be an easy ride
Worst collapse in productivity on record
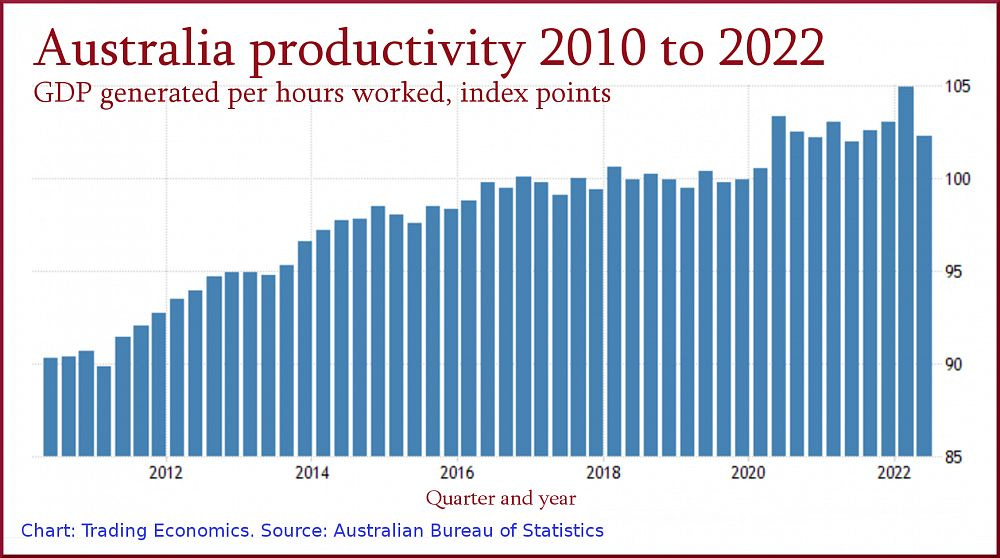
Productivity, which measures GDP generated per hour of employment over the whole economy, slipped badly in the June quarter to a dismal 102.3 index points. This is a collapse of 2.1 points over the last quarter, the worst quarterly slump on record. It is also a decline of 0.6 points over the last two years. See red and white chart, below.

In normal times under competent management, productivity improves year on year. In Australia, however, productivity flatlined from the second quarter of 2016 to the second quarter of 2020. There was a sudden lift then, due to hours worked tumbling during the COVID recession. Then another flat period through 2020 and 2021.
With productivity static – let alone declining – real wage rises are virtually impossible.
Income shifting steadily from wages to profits
Australia is an extremely rich country. Total factor income – the measure of national earnings the ABS uses in this series – hit a new record high in the June quarter at a thumping $554.2 billion. Total income for the financial year to June was an impressive $2,098.5 billion, an increase of 7.9% over the previous year (ABS file 5206, table 7).
That is the highest annual increase since 2011, during the recovery from the Global Financial Crisis. Australia is in a remarkable boom.
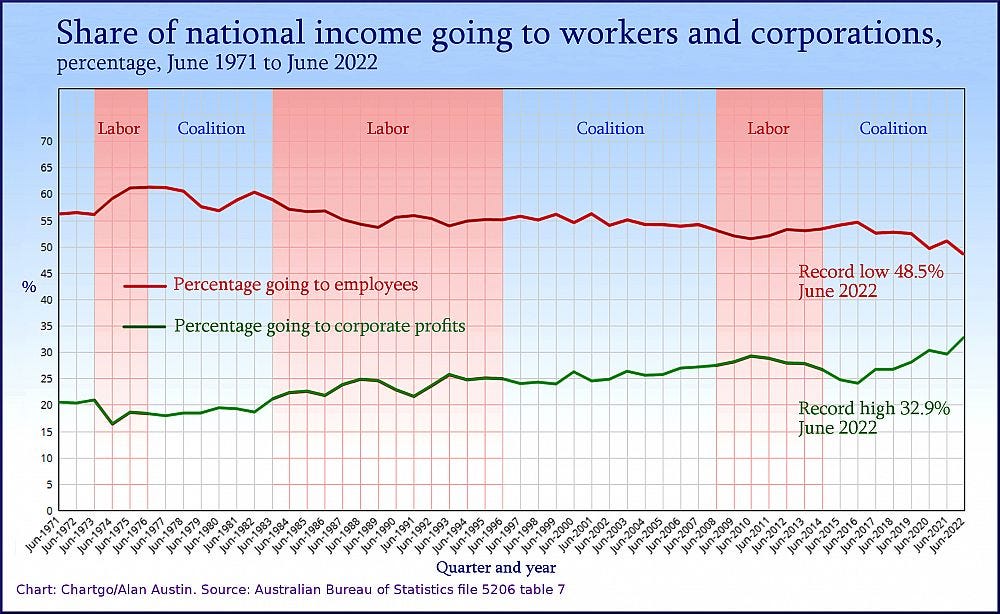
But here’s the thing. The share of the nation’s surging income going to employees fell in the June quarter from 51.0% in June last year to an all-time low of 48.5%. That is a decline in the last six years of 6.1%, down from 54.6% in June 2016 to 48.5% in the June quarter of this year. (Back in the Whitlam and Fraser years, this was above 60%.)
Correspondingly, the share of national income going to corporate profits increased from 24.1% in June 2016 to 32.9% in June this year, up a thumping 8.8%. See blue chart, below.

The corporate bonanza continues
We can measure in dollars the shift in income from workers to corporate profits resulting from Coalition policy settings over the last nine years.
Total income, as we have seen, was $2,098.5 billion in the year to June. When the Coalition took office in 2013, employees collected 53.1% of this. That would have been $1,113.9 billion. Now workers only collect 48.5%, which is just $1,017.0 billion, a difference of $96.9 billion.
With 11,407,300 Australians employed, that’s an average of $8,495 per worker. That is the extra annual salary employees would be receiving now, on average, had the distribution of income remained unchanged over the last nine years.
Where have those 8,000-plus dollars per worker gone? Straight offshore to the headquarters of multinational corporations, or into the pockets of Australian company owners, that’s where.
This has not only impoverished Australia’s workers, but has reduced tax revenue available for social services and blown out budget deficits and the federal debt.

Trajectories structurally fixed
The red line in the graph above shows a steady decline in workers’ remuneration over the last six years, with just one significant reversal. The green line shows the corresponding profit increase. This suggests the entire economy is now structurally geared to keep shifting income in this direction.
Hence fairly drastic remedial measures may be required. Are Prime Minister Albanese, Chalmers and their Cabinet colleagues up to this? We shall see.
Chalmers’ challenge
The Treasurer will hand down a detailed federal budget next month which will reveal his intended strategies and expected outcomes. His priority must be to rectify wages, reform the tax system and shift the share of the nation’s booming revenues back into a fair balance.
This may take some years to accomplish fully. If he can get started in October, we will all be very “reasured”.
https://youtu.be/OpK79ovcP5o
Alan Austin is an Independent Australia columnist and freelance journalist. You can follow him on Twitter @alanaustin001.


