Going Down: The Six Graphs that Show Australia’s Economic Growth Shrinking
John Hawkins, University of Canberra
The latest national accounts tell us Australia’s economy grew by just 0.2% in the three months to March.
It’s the weakest growth since the economy shrank during the COVID lockdowns, and, before that, the weakest economic growth since December 2018.
If economic growth continued at that pace for four quarters, the annual rate would be 0.8%, the weakest outside of a recession.
And the quarterly pace is shrinking. Economic activity grew 0.8% in the June quarter of 2022, 0.6% in the September and December quarters, and most recently, in the March quarter, only 0.2%.
The earlier stronger growth means gross domestic product is 2.3% larger than a year ago, a figure that looks set to become the highest for some time, but which looks less impressive when set aside the 2% growth in population.
Per person, gross domestic product shrank by 0.2%, the most outside of a COVID lockdown period since 2016.
The main drivers of economic growth were business investment and exports of services.
But there was weakness in consumer spending, with spending on discretionary items slipping.
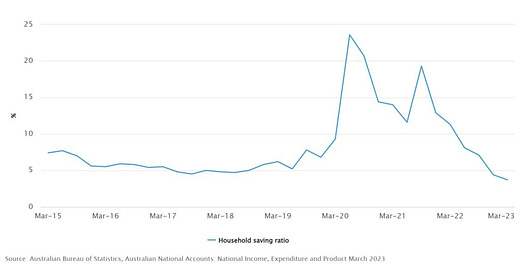
Households were only able to increase their essential spending (on things such as fuel, transport and rent) by saving less. Australia’s household saving ratio, the proportion of income saved, fell to just 3.7% – the least since 2008.
Mortgage interest expenses doubled over the year to the March quarter, and dwelling investment fell by 1.2% in the quarter, and 4.4% over the year.
Business investment increased, climbing 2.4% in the quarter, but much of it was imported capital equipment, which detracted from GDP. Exports increased, with the return of international students to Australian campuses an important contributor.
Who is getting what national income there is?
There has been some debate about how the national pie is being shared. Related is an argument about whether it is greedy businesses or greedy workers that are responsible for higher inflation.
Australian Council of Trades Unions Secretary Sally McManus points out that labour’s share of GDP is near its lowest since the quarterly national accounts began in 1959. The profit share is near its highest.
The Australia Institute has argued that most of the current excess inflation is attributable to higher corporate profits, an assessment that has been critiqued by the Reserve Bank and Treasury.
Much of the overall increase in the profit share is attributable to the mining sector.
The profit share in mining is around the highest in at least two decades, due almost entirely to higher commodity prices since Russia invaded Ukraine.
In the rest of the economy, the profit share is not exceptional.
What does it mean for your mortgage?
Inflation appears to have peaked around the end of 2022, but the Reserve Bank is hyper-alert to any sign that inflation may not be declining towards its 2-3% target as rapidly as it would like.
Its most recent forecasts published in May (which assumed no further increases in interest rates) envisaged inflation returning to 3% by mid-2025.
Governor Philip Lowe’s statement following Tuesday’s board meeting suggests such a path is the slowest return to the bank’s target he will accept – the “narrow path” he spoke about Wednesday morning.
Lowe believes the net impact of the budget, the main economic event last month, was to reduce inflationary pressures.
Despite this, his board lifted interest rates again at its meeting this week.
The bank’s forecasts have annual economic growth slowing from 2.7% at the end of 2022 to 1.75% by mid-2023.
Today’s data is in line with that forecast, and so should not put any more pressure on the bank to increase interest rates further.
Its longer-term concern is labour productivity. Real GDP per hour worked has barely increased over the past few years. Lowe says this makes wage increases more likely to add to inflation and reduces the leeway he has to hold off on pushing up rates.
John Hawkins, Senior Lecturer, Canberra School of Politics, Economics and Society, University of Canberra
This article is republished from The Conversation under a Creative Commons license. Read the original article.


